Profiling
Do you suspect a memory leak, a thread deadlock or unusually high CPU usage? CloudCaptain makes it trivial to profile your apps.
Enabling JMX remote management
To enable remote management of your JVM via JMX simply fuse or run your image with -jvm.jmx. This
will open an additional port to which your JMX client (like Java VisualVM or Java Mission Control) can connect. By default
this port is restricted to only allow connections from the IP address of
your local machine and you will need the following credentials to log in:
- User: boxfuse
- Password: boxfuse
When you launch an instance of an image set up for JMX remote management you should see a message like this:
> boxfuse run myapp.jar -jvm.jmx

...

Ready to accept JMX connections -> 127.0.0.1:1099 (user: boxfuse / password: boxfuse)
Configuring the JMX port
You can configure both the port number as well as the restrictions by manually specifying -ports.jmx=...
when fusing or running your image. You can use any of the usual formats for
defining the port. Just remember that the protocol must be tcp and that you of course should be able to access it.
Profiling with Java VisualVM
Start by launching Java VisualVM:
> jvisualvm
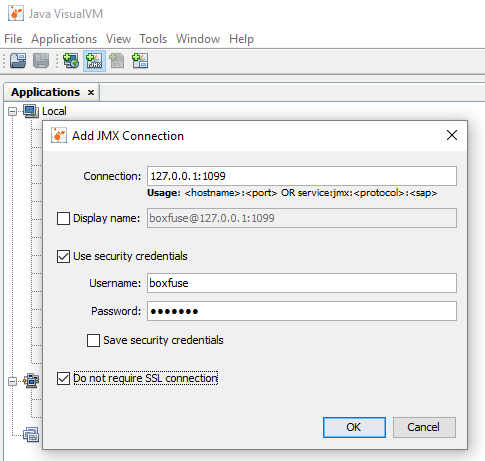
You can then simply connect Java VisualVM to that address using those credentials by adding a JMX connection:
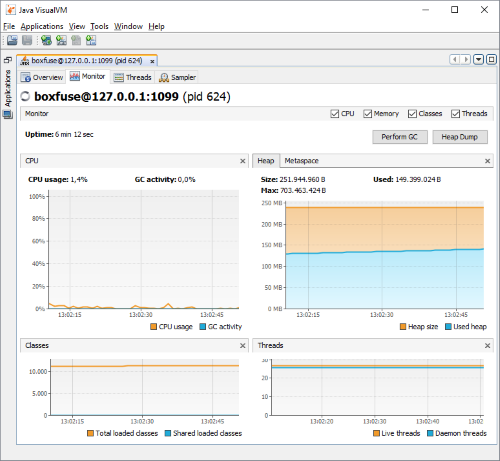
And you can now profile CPU, memory and threads as you normally would:
Profiling and Managing with Java Mission Control
Start by launching Java Mission Control:
> jmc
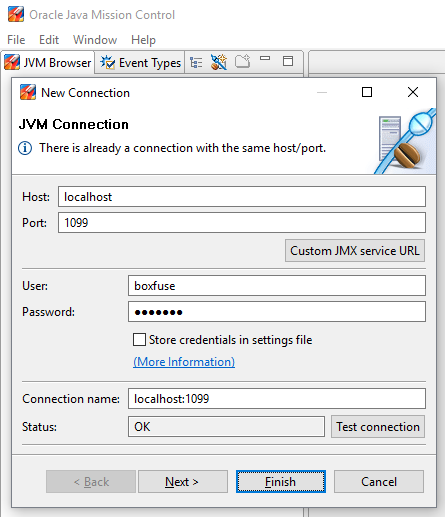
You can then simply connect Java Mission Control to that address using those credentials by creating a JVM connection:
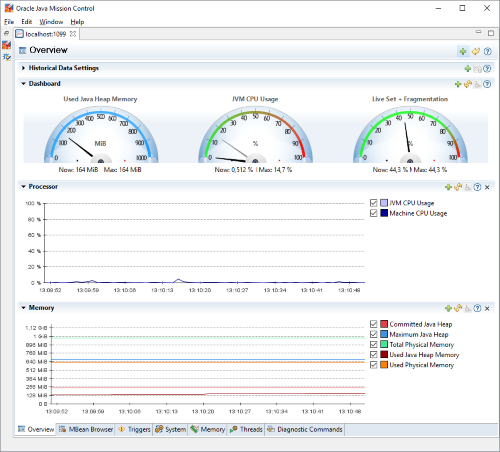
Finally select MBean Server and profile CPU, memory and threads as well as inspect and invoke actions on MBeans as you normally would: