Debugging
Sometimes you need to understand exactly what's going on inside your instances. CloudCaptain makes it trivial to remotely debug your apps, regardless of whether they run on VirtualBox or AWS.
Enabling remote debugging
To enable remote debugging simply fuse or run your image with -debug. This will open an additional
port to which your debugger can connect. As the JVM and Node.js debugging protocols don't have any authentication, by default
this port is restricted to only allow connections from the IP address of
your local machine.
When you launch an instance of an image set up for remote debugging you should see a message like this:
> boxfuse run myapp.jar -debug

...

Ready to accept remote debugger connections -> tcp://127.0.0.1:5005
Configuring the debug port
You can configure both the port number as well as the restrictions by manually specifying -ports.debug=...
when fusing or running your image. You can use any of the usual formats for
defining the port. Just remember that the protocol must be tcp and that you of course should be able to access it.
Connecting from your IDE
You can then simply connect the debugger of your favorite IDE to that address:
JVM apps
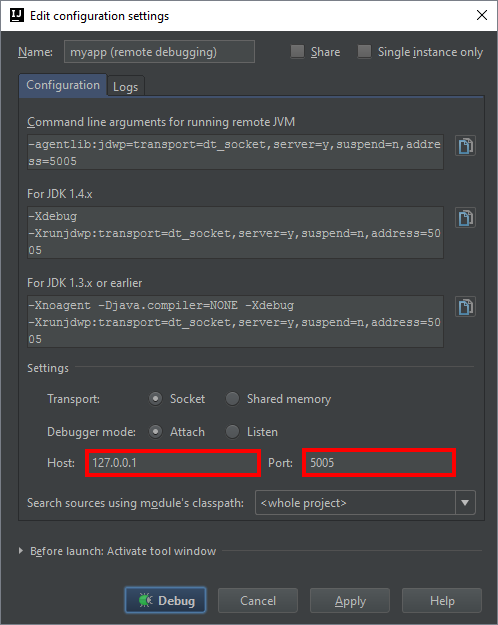
And now simply add breakpoints, step through the code, and evaluate expressions as you normally would.
Tip: If you need to debug an application startup issue, you can add -debug.wait to make the app wait
for a remote debugger connection before starting up.
Node.js apps
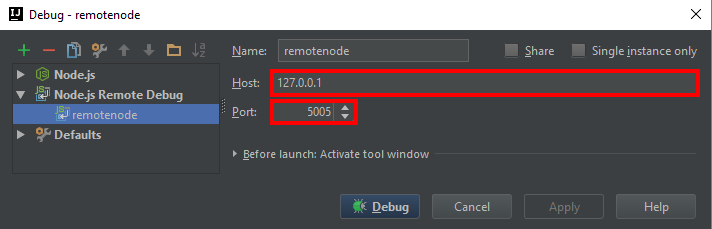
And now simply add breakpoints, step through the code, and evaluate expressions as you normally would.