Debugging and Profiling
2016-02-18 by Axel Fontaine
CloudCaptain makes it trivial to fuse and run your JVM-based applications unchanged both on VirtualBox and on AWS. This perfect environment parity, where your machine in prod is absolutely identical to the one in dev, makes it much easier to discover and correct issues sooner. But sometimes you still need to dig deeper into your running application to fully understand what's going on.
Today we are introducing support for dead easy debugging and profiling, both locally on VirtualBox and in the cloud on AWS.
Debugging
When the logs aren't helping anymore, it is time to roll up your sleeves and pull up your favorite debugger to step through the code and truly understand exactly what's going on. CloudCaptain now makes it trivial to remotely debug your apps, regardless of whether they run on VirtualBox or on AWS.
Start by launching an instance set up for remote debugging:
> boxfuse run myapp.jar -debug

...

Ready to accept remote debugger connections -> tcp://127.0.0.1:5005
The -debug flag opens an additional
port to which your debugger can connect. As the JVM debugging protocol doesn't have any authentication, by default
this port is restricted to only allow connections from your local machine.
Now pull up your favorite IDE and connect its debugger to the address shown above:
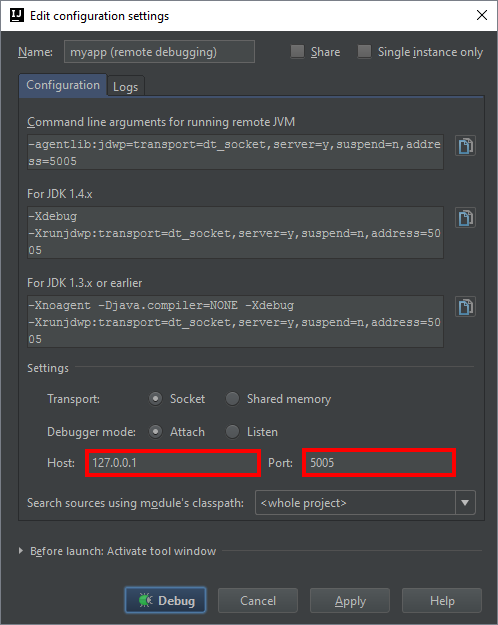
And that's it! Simply add breakpoints, step through the code, and evaluate expressions as you normally would, regardless of whether your instance runs on VirtualBox or on AWS.
Profiling
Do you suspect a memory leak, a thread deadlock or unusually high CPU usage? CloudCaptain now makes it trivial to profile your apps, regardless of whether they run locally or in the cloud.
Start by launching an instance set up for JMX remote management:
> boxfuse run myapp.jar -jvm.jmx
...
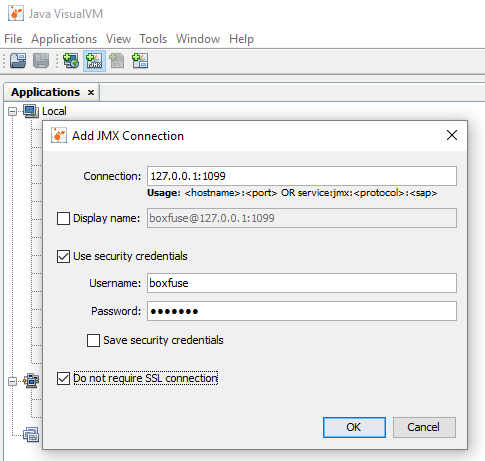
Ready to accept JMX connections -> 127.0.0.1:1099 (user: boxfuse / password: boxfuse)
The -jvm.jmx flag opens an additional
port to which your JMX client (like Java VisualVM or Java Mission Control) can connect. By default
this port is restricted to only allow connections from
your local machine.
Profiling with Java VisualVM
Simply launch Java VisualVM:
> jvisualvm
And connect to the address above:
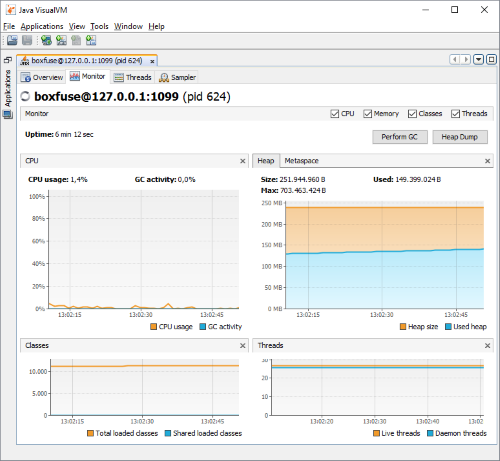
And that's it! Go ahead and profile and analyse CPU, memory and threads as you normally would:
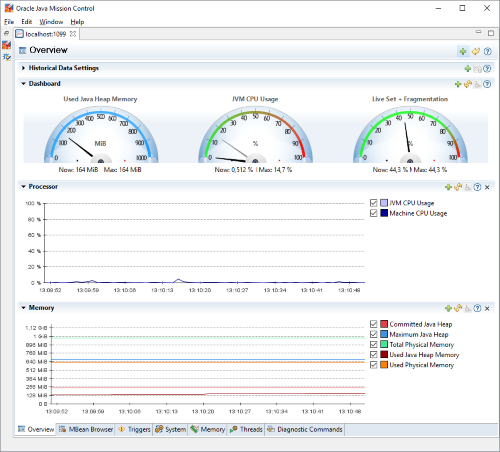
Profiling and Managing with Java Mission Control
Alternatively you can also use the newer Java Mission Control to profile and manage your app:
> jmc
Simply connect Java Mission Control to the address above by creating a JVM connection:
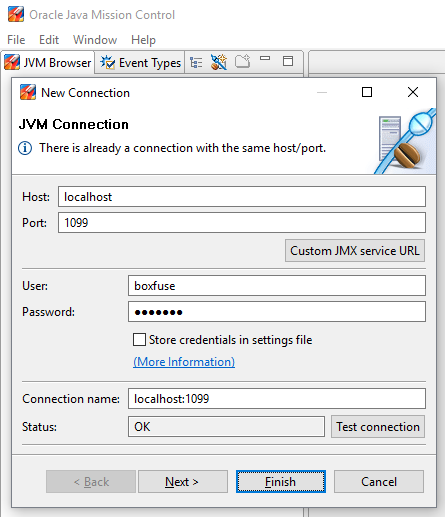
Finally select MBean Server and profile CPU, memory and threads as well as inspect and invoke actions on MBeans as you normally would:
As you would expect this of course works identically on both VirtualBox and AWS.
Summary
In this post, we introduced dead easy debugging and profiling for CloudCaptain instances, both locally on VirtualBox and in the cloud on AWS.
CloudCaptain now makes it trivial to remotely debug your application directly from your favorite IDE. Additionally you can now enable JMX remote management to easily profile and manage your JVMs using tools like Java VisualVM and Java Mission Control.
So if you haven't already, simply log in to the CloudCaptain Console with your GitHub id and download the CloudCaptain Client to run, debug and profile your JVM application on AWS today. Enjoy!