Introducing AWS CloudWatch Logs support with Live Tailing
2016-10-07 by Axel Fontaine
Logging provides critically important visibility into the inner workings of our applications and offers a great way to perform both live and post-mortem analysis of interactions with our systems.
To be able to enjoy those benefits effectively a logging solution must possess a number of important qualities including durability, security, availability, searchability and speed.
We must also distinguish between two important types of logs: instance boot logs and application logs.
Instance boot logs collect information from the earliest stages of instance startup (bootloader and kernel boot) all the way to the point where the application is fully configured and ready to start shipping log events to the logging service of our choice. This makes instance boot logs great for identifying early environment-specific network and application configuration issues that may prevent an application from coming up correctly and start logging them in the first place.
Application logs are all the logs produced by our application from that point on.
For the latter CloudCaptain provided no out-of-the-box solution until now and you had to rely on external solutions to fill that gap. Today we are introducing first class AWS CloudWatch Logs integration to close this gap.
So without further ado, let's dive in and look at it in more detail!
Centralized Logging
In a modern microservices and cloud architecture, a single client request can end up traversing multiple services. Each of those services is then auto-scaled across a number of machines to have the appropriate capacity to handle the current load at all times.
This has a number of serious implications:
- If more than one service is triggered by the request, more than one machine will produce logs related to that request.
- The exact machine which will handle that specific request for each service is determined in real time by the load-balancer and not known in advance.
- A machine which may have handled requests a few minutes ago, may now be terminated due to a change in load of the system having triggered a scale-in activity.
Additionally in the world of immutable infrastructure and minimal images there is a strong focus on security and the principle of least privilege, which also means there is no SSH on board of the running instances.
These realities effectively mean that application logs cannot be stored on the instance itself. Instead they must be shipped to a centralized logging service where they can then be securely stored and made available.
This is a great solution as it allows us to centrally enforce, enable and control a number of things.
Durability
Logs must be retained for the time required to perform useful analysis on them. Their value often decreases sharply over time. This stands in stark contrast to the space they occupy and the cost associated with it. It is therefore crucial to choose an appropriate retention period to strike the right balance between storage cost and historical usefulness.
The other important aspect of having a centralized logging service is enabling logs to outlive the machines that produced them.
Security
It is often forgotten that logs usually contain a lot of sensitive information. It crucial that the protection of this information be held to the same standards as the information present in our other systems. This means there is a shared responsibility here. On the one hand it is the responsibility of the centralized logging service to provide strong access controls. On the other hand, it is also your responsibility to carefully evaluate whether certain kinds of information maybe shouldn't be obfuscated or left out of the logs in the first place.
Availability
Since a load-balancer may send a request to any instance of a service and that service may in turn call many other services, a centralized logging services is a life-saver for actually finding the logs related to that request. No more searching for a needle in a haystack. Instead all the logs are available from one central place. Equally important here of course is the fact that due to auto-scaling events some of the machines which have produced logs may be long gone by the time someone is ready to analyse them.
Searchability
A centralized logging service makes it trivial to search all logs in one go. This includes all the logs produced by all instances of all services within an environment. This makes it possible to easily obtain all the logs for things like:
- a single request across services
- all sessions for a single user across one or more services
- all instances of an application
And many more!
Speed
Of course to be usable a centralized logging service must also come with logging agents installed on the clients that produce as little runtime performance overhead as possible. For this it is essential that the sending of logs events to the service be asynchronous and non-blocking to the regular request processing flow. In a lot of cases today the network is actually very reliable and fast. Smart batching in memory virtually eliminates the need for on-disk buffering which is often slower than sending the events directly over network as the disks often aren't local anyway!
AWS CloudWatch Logs
So far in order to use a centralized logging service with CloudCaptain one had to rely on an external service like Loggly, Logentries or Papertrail, or set up their own ELK stack. AWS however also has their own service for this called CloudWatch Logs and CloudCaptain now has first class support for it!
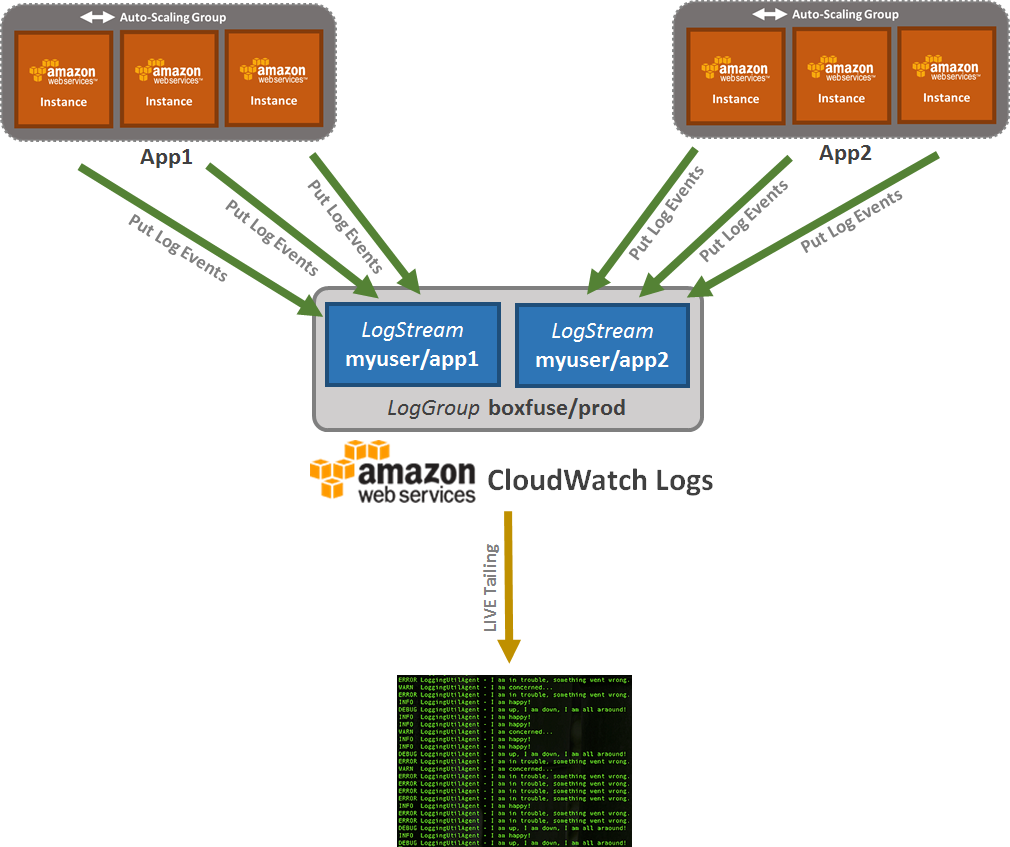
At its core CloudWatch Logs is an API for ingesting and querying log events. It revolves around three simple concepts: Log Groups, Log Streams and Log Events.
Log Events
Log events are the actual log messages produced by your application. To be able to send those to CloudWatch Logs you need some kind of client to talk to the CloudWatch Logs API. By default AWS provides an agent to take care of that. It is unfortunately written in Python and comes with a long string of dependencies. In other words, it simply isn't a good fit for CloudCaptain's minimal images, so we had to come up with a better solution! More about this in a minute...
Log Streams
Log streams are the destination where log events get sent to and can be queried from.
With CloudCaptain, each application deployment within an environment receives its own log stream.
Log Groups
Log groups contain one or more log streams. Streams physically belong to a log group. Log events can also be queried across multiple streams at once at the log group level. And log event retention can also be configured for an entire group at once.
With CloudCaptain, each environment receives its own log group, containing all the logs streams of the applications deployed within that environment.
Seeing it in action
So let's see how this works in practice!
Creating an app with AWS CloudWatch Logs support
The first step is to create a new application configured for CloudWatch Logs:
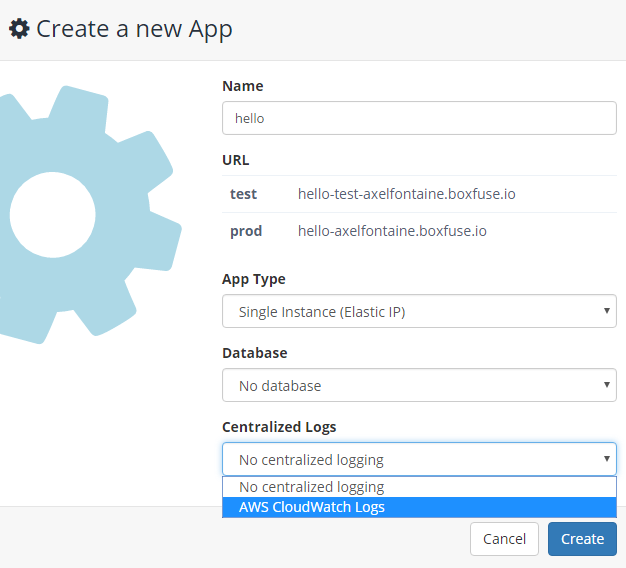
We could also have done the same by using the CloudCaptain Client by creating an app with logs.type set to cloudwatch-logs:
> boxfuse create hello -logs.type=cloudwatch-logs
Fusing an image (including automatic agent installation and configuration)
As mentioned above, to be able to send events to AWS CloudWatch Logs a client is needed to talk to the API and unfortunately the official AWS agent doesn't cut it.
We are therefore today releasing a new open-source CloudWatch Logs agent written in Go that is optimized to work within CloudCaptain instances.
It has a very small footprint (3 MB) and is designed to asynchronously redirect stdout and stderr output of an application to CloudWatch Logs.
Now let's fuse an image of our app:
> boxfuse fuse hello.war
This will automatically install both our application and the CloudWatch Logs agent. Two copies of the agent will be running. One to redirect stdout output of the application to CloudWatch logs as INFO
log events and the other to do the same for stderr output as ERROR log events.
Running an instance on VirtualBox
If we now run an instance of our application on VirtualBox using
> boxfuse run hello:1.0
CloudCaptain will also automatically launch a local CloudWatch Logs mock which will be ready to ingest log events as soon as the application starts sending them.
Running it on AWS
If we launch an instance on AWS with
> boxfuse run hello:1.0 -env=prod

...
Creating Log Group boxfuse/prod ...
Creating Log Stream boxfuse/prod > myuser/hello ...
...
You'll notice that both a Log Group for the CloudCaptain prod environment as well as a Log Stream for the myuser/hello app were created.
The latter which the CloudCaptain CloudWatch Logs agent installed on your instance will now start sending log events to.
Any stdout and stderr console output produced by our application will now be redirected to that log stream.
Retrieving the log events
To view the log events produced by our application all we need to do is
> boxfuse logs hello -env=prod
And you'll see the logs appearing in your terminal.
Live Tailing
But sometimes however it is also immensely useful to be able to follow logs in real time. And we are happy to announce
that you can now do so both on VirtualBox and on AWS by simply appending -logs.tail to our prevent command:
> boxfuse logs hello -env=prod -logs.tail
Any new logs produced by your application will now immediately be shown on your machine for as long as the CloudCaptain Client is running. We have optimized things so that logs are delivered directly from AWS to your local machine, bypassing all CloudCaptain infrastructure.
Summary
CloudCaptain now has first-class support for AWS CloudWatch Logs. This gives you access to a centralized logging service which comes with durability, security, availability, searchability and speed.
With apps created to take advantage of this, your images are automatically fused with our brand new open-source CloudWatch Logs agent which is fully configured to redirect both stdout and stderr to AWS CloudWatch Logs.
CloudCaptain also automatically starts a local CloudWatch Logs mock to provide you with the same experience when running on VirtualBox.
And last but not least you now have easy access to your logs, including live tailing for both VirtualBox and AWS.
This new feature is available at no charge to all CloudCaptain users.
So if you haven't already, sign up for your CloudCaptain account now (simply log in with your GitHub id, it's free) and start deploying your applications effortlessly to AWS in minutes and enjoy the great integration with CloudWatch Logs from the start.